|
Methodology
Research projects by Hanowski and Niemi
(1995), Howe et al. (1996), Howe
and Mossman (1996), and others have collectively contributed thousands of
point-centered bird counts that form the foundation of our proposed analysis.
A standard method (Howe et al. 1997) facilitates comparisons among these different
studies and has led to an extensive geographic coverage of bird studies the Great Lakes region.
In addition, biologists at the Natural Resources Research Institute have compiled and
georeferenced data from the North American Breeding Bird Survey (Sauer et al.
1999),
a continent-wide monitoring effort that uses a series of short duration point (3 minute) counts.
Although these counts are shorter than the 10 minute standard recommended by Howe et al.
(1997),
the Breeding Bird Survey data cover a large geographic area and can be analyzed in similar ways
as the longer duration point counts. Comparison of results using these data sets will indicate
the robustness of bird-habitat models and may be used in a meta-analysis to establish
confidence limits for the predicted distribution maps.
Measurements used in the proposed analysis will consist of both bird-related
data and independent variables describing the characteristics of bird sampling points. The
bird data will come from the following sources:
- Standardized 10 minute point counts in northern forest regions of Michigan, Minnesota, and
Wisconsin.
Hanowski, Howe, Niemi and colleagues have accumulated hundreds of point counts in the
Chequamegon-Nicolet, Superior, and Chippewa National Forests of Minnesota and Wisconsin.
Additional counts have been conducted on other public and private lands as part of separate
research projects. Point counts that will be used in our proposed analysis were gathered by
field workers who have undergone special training and testing or who have demonstrated bird
identification skills through research experience or recommendations by established field
researchers (Hanowski and Niemi 1995). Field observers in Wisconsin have benefited from a
custom-made CD of breeding bird songs and calls provided by the U.S. Forest Service to
participants in the Nicolet National Forest Bird Survey (Howe et al.
1996).
- North American Breeding Bird Survey (BBS) routes conducted during 1990-98 in the Laurentian
Forest regions of Minnesota, Michigan, and Wisconsin.
Contributors to the Breeding Bird Survey are screened by state coordinators who assert
quality control over results that are submitted each year. Precise locations of each route have
been determined by technicians at the Natural Resources Research Institute and subsets of
"stops" (3 minute point counts) along each route can be selected to provide a more precise
geographical sample.
- Targeted bird surveys for species that are poorly represented in the Breeding Bird Survey
or standardized point counts.
During summer 2000, with funding from The Nature Conservancy, researchers at UW-Green Bay
have documented specific localities for six species that are either uncommon or have declined
significantly in parts of their range (Olive-sided Flycatcher, Black-and-white Warbler,
Black-throated Blue Warbler, Cape May Warbler, Canada Warbler, and Connecticut Warbler).
Presence of territorial males is established by playback of species-specific songs and visual
identification of the birds. At each locality, GPS coordinates are recorded and habitat
characteristics noted for "ground-truthing" remotely sensed land cover data.
Like any field sampling of breeding birds, errors in identification are inevitable in the
point count and BBS results. Our approach to quality control of these data for high priority
species will be to identify "outliers" (points where a species is present in unexpected habitat)
through statistical analysis and to conduct field surveys during 2001 at these and other sites.
The influence of erroneous records is likely to be less significant than in many other studies
because of the large sample size of data points available for our analysis. In multi-year
samples such as the national forest point count surveys, we can eliminate points where a species
was recorded during only a single year's census. This approach will greatly minimize the
chances of spurious observations and will improve the data quality significantly.
We will derive a suite of potential predictor variables from both land cover
and climate data. From our previous work in the Great Lakes Basin, we have access to 35
climate variables that include measures of precipitation, temperature and length of growing
season as well as measures of the variability (e.g., coefficient of variation) of each variable. Based on previous experience we expect to include variables describing the proportional composition by cover type at each bird survey point. In addition to these compositional variables, we will use FRAGSTATS
(McGarigal and Marks 1995) and APACK
(Mladenoff and DeZonia 2000) to calculate metrics that describe the landscape pattern surrounding each survey location. Landscape metrics that have been shown to be useful in predicting bird distribution include: patch richness, contagion, Simpon's diversity index, dominance, contrast-weighted edge density. APACK will be used to calculate lacunarity and as validation of the algorithms contained in FRAGSTATS. Compositional and landscape variables will be calculated within buffers of 250, 500 and 1,000 meters from each survey location.
All derived variables will be maintained in Microsoft Access, a relational
database management system. Locations of the 460 survey points in the Chequamegon, Chippewa
and Superior National Forests were originally digitized from USGS topographic maps. During
the summer of 2000, researchers at NRRI are checking the accuracy of these locations by
overlaying digital maps of the forest stands obtained from each national forest. Similarly,
during the summer of 2000 researchers at UWGB, using funds from the US Forest Service and The
Nature Conservancy, are ground-truthing and georeferencing with differential GPS equipment
the location of all 500+ survey points in the Nicolet National Forest Bird Survey.
Given the potentially large and complex nature of independent variables, we
plan to use two important new statistical techniques, Classification and Regression Trees
(CART, Breiman et al. 1984) and Multivariate Adaptive Regression Splines (MARS,
Friedman 1991).
Both CART and MARS are used increasingly for predictive modeling in ecological applications
(e.g., Baker 1993, Hernandez et al.
1997). These nonparametric methods are
less constrained than traditional methods like multiple linear regression and logistic
regression. Software programs for these methods are available from Salford Systems
(CART, MARS) and Insightful Corp. (S-Plus) and are included in our budget. Jones, who will be leading the
modeling portion of our proposed project, has more than 7 years' experience using CART as a
statistical modeling method (e.g., O'Connor and Jones
1997).
Predictive models will be used to generate detailed maps of bird distributions.
Each map will identify areas where species or groups of species have a high probability of
occurrence or high abundance. "Hotspots" of bird conservation will emerge by combining maps
of sensitive species, weighted according to an independent priority scheme (Thompson et al.
1993, Niemi et al. ms). ArcInfo/ArcView software will be used to generate maps from the
predictive models and to make them available for the web-based applications. Consultation
with David Ewert and other scientists will help identify suites of high priority species
that are not adequately represented in existing protected areas.
An important element of our proposal is the testing or validation of
quantitative predictions. During 2001 trained field observers will travel to previously
unvisited localities where selected species are predicted to occur. Using song playback from
custom made CD's, these observers will determine whether or not the predicted species are
present. We expect to test this method on approximately 10-15 species of high conservation
priority in this region (e.g., Olive-sided Flycatcher, Golden-winged Warbler, Black-throated
Blue Warbler, Canada Warbler, Connecticut Warbler). Results from this fieldwork can later be
incorporated into the quantitative analysis to improve the predictive models and related maps.
Our goal is to establish a framework that can be continuously upgraded based on new field
information, even after the completion of our proposed project.
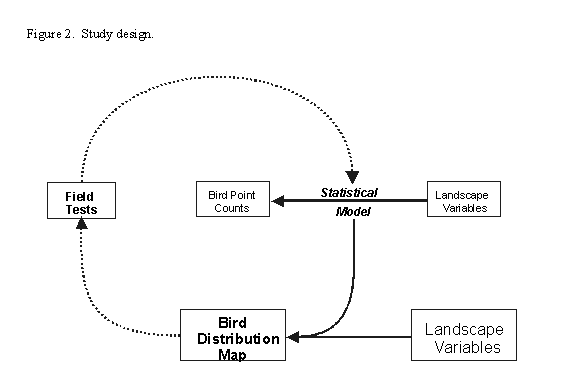
The general design of our proposed analysis is illustrated below.
This scheme is meant to provide continual improvement of the distribution map based on
iterative field testing of the predicted localities for bird occurrences or abundance
(Hilbourn and Mangel 1997). The original distribution maps will be developed with existing
data, representing well over 1000 localities. During summer of 2001, additional
(previously not visited) points will be sampled based on predicted probability of occurrence
or abundance. The number of points visited will depend on availability of funding;
if this proposal is supported, we will expect to visit approximately 1500 new localities
using custom recordings for playback/detection of target species.
|