
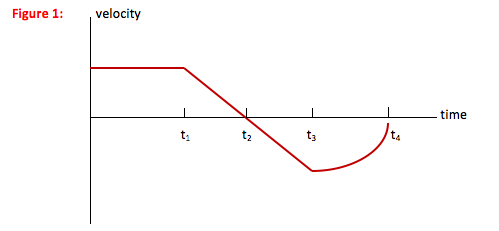
You drive a car in such a way that its motion is described by the velocity-time graph shown here. Draw the displacement-time and acceleration-time graphs that correspond to this motion, and describe in words how the car moves.
-
In this problem, you are asked to describe the motion of the car. Whenever you are asked to describe the motion of an object without worrying about the cause of that motion, you have a kinematics problem. This problem is different from most kinematics problems, however, in that you are not asked for a numerical description but rather to use words and graphs to describe how the car moves.
-
In this problem, the initial picture is provided for you. Continue to Select a Relation to draw the other two graphs.
-
To go between a velocity-time graph and a displacement-time or acceleration-time graph, you need to understand how velocity, displacement and acceleration are related to each other. In other words, you need to use the definitions of velocity and acceleration:
v = Δx/Δt
In words, the value of velocity = the slope of the x-t graph.
a = Δv/Δt
In words, the value of acceleration = the slope of the v-t graph.
Hint: Graphing problems seem like they should be straightforward, and the equations that you need are only those given above. It is very, very common, however, to make mistakes on these problems because it feels like the graphs should be pictures of the motion and they are not. In order to avoid those mistakes, make a table based on the sentences above and then draw the graph from the table.
-
Step 1:
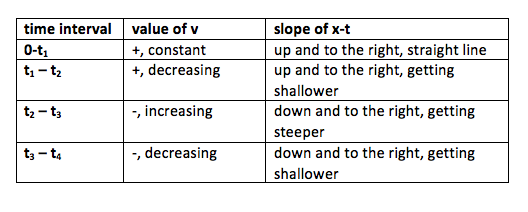
Displacement-time graph
Once you understand the displacement-time graph, continue down to the acceleration-time graph.
------------------------------------------------------------------------
Step 2:
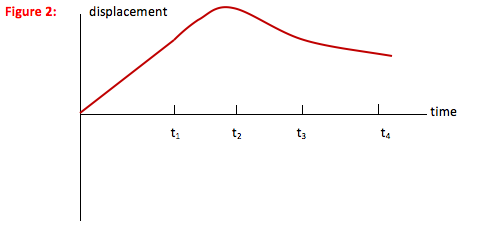
Acceleration-time graph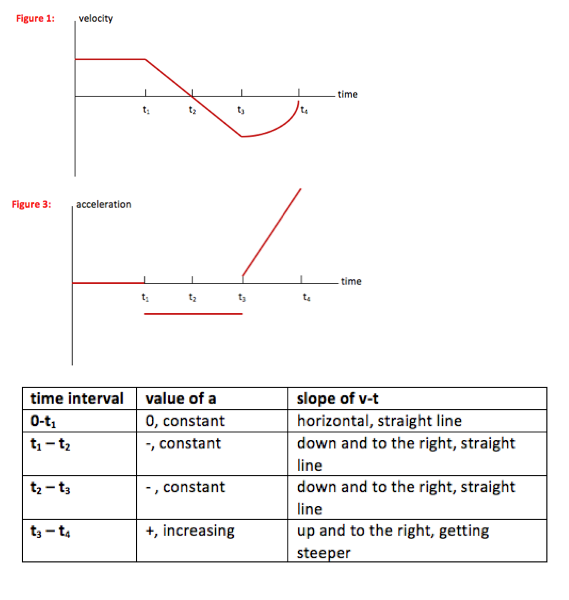
Once you understand the acceleration-time graph, proceed to the Understand page to describe the car’s motion in words.
How do you know that the value of velocity = the slope of the x-t graph?
The definition of slope is rise over run, or slope = Δy/Δx.
For the displacement-time graph, the y-axis is displacement and the x-axis is time, so slope = Δx/Δt.
But the definition of velocity = Δx/Δt, so velocity is the slope of the x-t graph.
I am very careful to emphasize that slope of x-t is the value of v in order to avoid common mistakes reversing the two or drawing them the same.How do you know that the value of acceleration = the slope of the v-t graph?
The definition of slope is rise over run, or slope = Δy/Δx.
For the velocity-time graph, the y-axis is velocity and the x-axis is time, so slope = Δv/Δt.
But the definition of acceleration = Δv/Δt, so acceleration is the slope of the v-t graph.
I am very careful to emphasize that slope of v-t is the value of a in order to avoid common mistakes reversing the two or drawing them the same.How did you know that x = 0 at t = 0?
You don’t! If you are given a velocity-time graph, you know the initial speed but not the initial location of the object. (Calculus students, remember v = dx/dt, and the derivative of a constant—your initial location—is zero.) I chose to call the location of the car at t = 0 the origin, but you could start your graph at any point. The shape of the graph, however, should look the same.
Why can’t I treat the straight line from t1 to t3 in a single step?
Any time velocity is above the t-axis, it has a positive value and so slope of the x-t graph is also positive. A positive slope means that the line or curve is in such a direction as to make between a 0 and a 900 angle above the +x axis.
Any time velocity is below the t-axis, it has a negative value and so the slope of the x-t graph is also negative. A negative slope means that the line or curve is in such a direction as to make between a 0 and a 900 angle below the +x axis.
Why doesn’t the line from t3 to t4 look more curved?
As the velocity-time curve gets closer and closer to v = 0 (the t-axis), velocity’s value is getting smaller regardless of direction. As the value of v decreases, so does the slope of the x-t graph. A decreasing slope means that the slope gets smaller and smaller—the line gets becomes more horizontal.
The curve from t3 to t4 on the x-t graph shown here doesn’t look very curved. This is because its slope goes from the same value as it ended with on the t2 to t3 curve to almost zero (a horizontal line) and so not a lot of change as I have drawn it. Any line you draw that curves down and to the right becoming more horizontal as it goes is fine.Any time the direction of the velocity curve is between a 0 and a 900 angle above the +x axis, the slope of the velocity curve is positive. A positive slope for the v-t graph means a positive value of acceleration.
Any time the direction of the velocity curve is between a 0 and a 900 angle below the +x axis, the slope of the velocity curve is negative. A negative slope for the v-t graph means a negative value of acceleration.
The definition of slope is rise over run, or slope = Δy/Δx.
For the velocity-time graph, the y-axis is velocity and the x-axis is time, so slope = Δv/Δt.
But the definition of acceleration = Δv/Δt, so acceleration is the slope of the v-t graph.
I am very careful to emphasize that slope of v-t is the value of a in order to avoid common mistakes reversing the two or drawing them the same.The definition of slope is rise over run, or slope = Δy/Δx.
For the displacement-time graph, the y-axis is displacement and the x-axis is time, so slope = Δx/Δt.
But the definition of velocity = Δx/Δt, so velocity is the slope of the x-t graph.
I am very careful to emphasize that slope of x-t is the value of v in order to avoid common mistakes reversing the two or drawing them the same.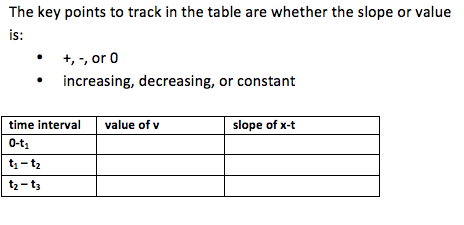
Any time velocity is above the t-axis, it has a positive value and so slope of the x-t graph is also positive. A positive slope means that the line or curve is in such a direction as to make between a 0 and a 900 angle above the +x axis.
Any time velocity is below the t-axis, it has a negative value and so the slope of the x-t graph is also negative. A negative slope means that the line or curve is in such a direction as to make between a 0 and a 900 angle below the +x axis.
When the velocity-time graph is a horizontal line, the value of velocity doesn’t change—it is constant and so is the slope of the x-t graph. A constant slope means that the line does not change in steepness—it continues straight without changing direction.
As the velocity-time curve gets further and further from v = 0 (the t-axis), the value of v is getting larger, regardless of direction. As the value of v increase, so does the slope of the x-t graph. An increasing slope means that the slope gets larger and larger—the line gets steeper.
As the velocity-time curve gets closer and closer to v = 0 (the t-axis), velocity’s value is getting smaller regardless of direction. As the value of v decreases, so does the slope of the x-t graph. A decreasing slope means that the slope gets smaller and smaller—the line gets becomes more horizontal.
The curve from t3 to t4 on the x-t graph shown here doesn’t look very curved. This is because its slope goes from the same value as it ended with on the t2 to t3 curve to almost zero (a horizontal line) and so not a lot of change as I have drawn it. Any line you draw that curves down and to the right becoming more horizontal as it goes is fine.Any time velocity is above the t-axis, it has a positive value and so slope of the x-t graph is also positive. A positive slope means that the line or curve is in such a direction as to make between a 0 and a 900 angle above the +x axis.
When the velocity-time graph is a horizontal line, the value of velocity doesn’t change—it is constant and so is the slope of the x-t graph. A constant slope means that the line does not change in steepness—it continues straight without changing direction.Any time velocity is above the t-axis, it has a positive value and so slope of the x-t graph is also positive. A positive slope means that the line or curve is in such a direction as to make between a 0 and a 900 angle above the +x axis.
As the velocity-time curve gets closer and closer to v = 0 (the t-axis), the value of velocity is getting smaller regardless of direction. As the value of v decreases, so does the slope of the x-t graph. A decreasing slope means that the slope gets smaller and smaller—the line becomes more horizontal.Any time velocity is below the t-axis, it has a negative value and so the slope of the x-t graph is also negative. A negative slope means that the line or curve is in such a direction as to make between a 0 and a 900 angle below the +x axis.
As the velocity-time curve gets further and further from v = 0 (the t-axis), the value of velocity gets larger, regardless of direction. As the value of v increase, so does the slope of the x-t graph. An increasing slope means that the slope gets larger and larger—the line gets steeper.A horizontal line has a slope of zero. Therefore, the value of acceleration is also zero.
Any time velocity is below the t-axis, it has a negative value and so the slope of the x-t graph is also negative. A negative slope means that the line or curve is in such a direction as to make between a 0 and a 900 angle below the +x axis.
As the velocity-time curve gets closer and closer to v = 0 (the t-axis), velocity’s value is getting smaller regardless of direction. As the value of v decreases, so does the slope of the x-t graph. A decreasing slope means that the slope gets smaller and smaller—the line becomes more horizontal.
The curve from t3 to t4 on the x-t graph shown here doesn’t look very curved. This is because its slope goes from the same value as it ended with on the t2 to t3 curve to almost zero (a horizontal line) and so not a lot of change as I have drawn it. Any line you draw that curves down and to the right becoming more horizontal as it goes is fine.Any time the direction of the velocity curve is between a 0 and a 900 angle above the +x axis, the slope of the velocity curve is positive. A positive slope for the v-t graph means a positive value of acceleration.
Any time the direction of the velocity curve is between a 0 and a 900 angle below the +x axis, the slope of the velocity curve is negative. A negative slope for the v-t graph means a negative value of acceleration.
When the velocity-time graph is a straight line, the value of its slope doesn’t change—it gets neither steeper nor shallower. When slope of v=t is constant, the value of acceleration is constant.
A horizontal line has a slope of zero. Therefore, the value of acceleration is also zero.
As the velocity-time curve gets steeper (more vertical,) its slope increases. Therefore, the value of acceleration also increases.
When the velocity-time graph is a straight line, the value of its slope doesn’t change—it gets neither steeper nor shallower. When slope of v-t is constant, the value of acceleration is constant.
A horizontal line has a slope of zero. Therefore, the value of acceleration is also zero.When the velocity-time graph is a straight line, the value of its slope doesn’t change—it gets neither steeper nor shallower. When slope of v=t is constant, the value of acceleration is constant.
Any time the direction of the velocity curve is between a 0 and a 900 angle below the +x axis, the slope of the velocity curve is negative. A negative slope for the v-t graph means a negative value of acceleration.Any time the direction of the velocity curve is between a 0 and a 900 angle above the +x axis, the slope of the velocity curve is positive. A positive slope for the v-t graph means a positive value of acceleration.
As the velocity-time curve gets steeper (more vertical,) its slope increases. Therefore, the value of acceleration also increases.How do you know that x = 0 at t = 0?
You don’t! If you are given a velocity-time graph, you know the initial speed but not the initial location of the object. (Calculus students, remember v = dx/dt, and the derivative of a constant—your initial location—is zero.) I chose to call the location of the car at t = 0 the origin, but you could start your graph at any point. The shape of the graph, however, should look the same.
How do I use the information in one graph to find another?
To go between a velocity-time graph and a displacement-time or acceleration-time graph, you need to understand how velocity, displacement and acceleration are related to each other. In other words, you need to use the definitions of velocity and acceleration:
v = Δx/Δt
In words, the value of velocity = the slope of the x-t graph.
a = Δv/Δt
In words, the value of acceleration = the slope of the v-t graph.I consistently mess up graphing problems like this. Any suggestions?
Graphing problems seem like they should be straightforward, and the only equations that you need are the definitions of velocity and acceleration. It is very, very common, however, to make mistakes on these problems because it feels like the graphs should be pictures of the motion and they are not. In order to avoid those mistakes, make a table based on the definitions and then draw the graph from the table. To see details, click on the graph segments in this example problem.
-
In this problem, you are given the velocity-time graph for the motion of a car. By relating the value of velocity to the slope of the x-t graph (this is just the definition of velocity) you are able to draw the x-t graph corresponding to this motion.
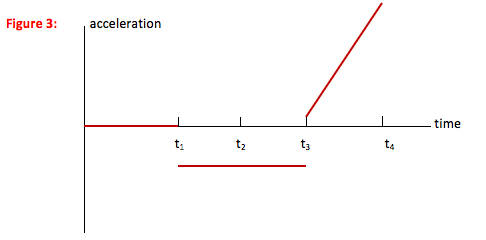
By relating the slope of the v-t graph to the value of acceleration (this is just the definition of acceleration) you are able to draw the a-t graph corresponding to this motion.
You can describe the motion looking at any of the three graphs.
From t = 0 to t1 : The car travels forward (+ direction) with a constant speed. There is no acceleration and the car moves away from its starting point at a constant rate.
From t1 to t2 : The car slows to a stop at a constant rate. It is still moving forward, but the amount of distance it covers in each second is decreasing. Acceleration acts against the motion of the car, or in the negative direction.
From t2 to t3 : The car reverses direction, moving faster and faster (at a constant acceleration) in the negative direction. Acceleration is acting with the motion of the car, so it is also in the negative direction. The amount of distance the car covers each second increases.
From t3 to t4 : The car continues to move in the negative direction but at a decreasing speed. The rate at which the speed decreases is getting greater—the driver is braking harder as the car stops—and so acceleration increases. Acceleration is acting against the motion of the car, or in the positive direction. The car covers less and less distance each second.