Fox River Watershed Maps
Watershed maps are crucial for understanding how land use impacts water quality. They help us visualize and analyze the connections between land and water.
Land Cover
Understanding the area of land cover is crucial because it helps us identify how different types of land use, such as agriculture, urban development and natural areas, affect water quality.
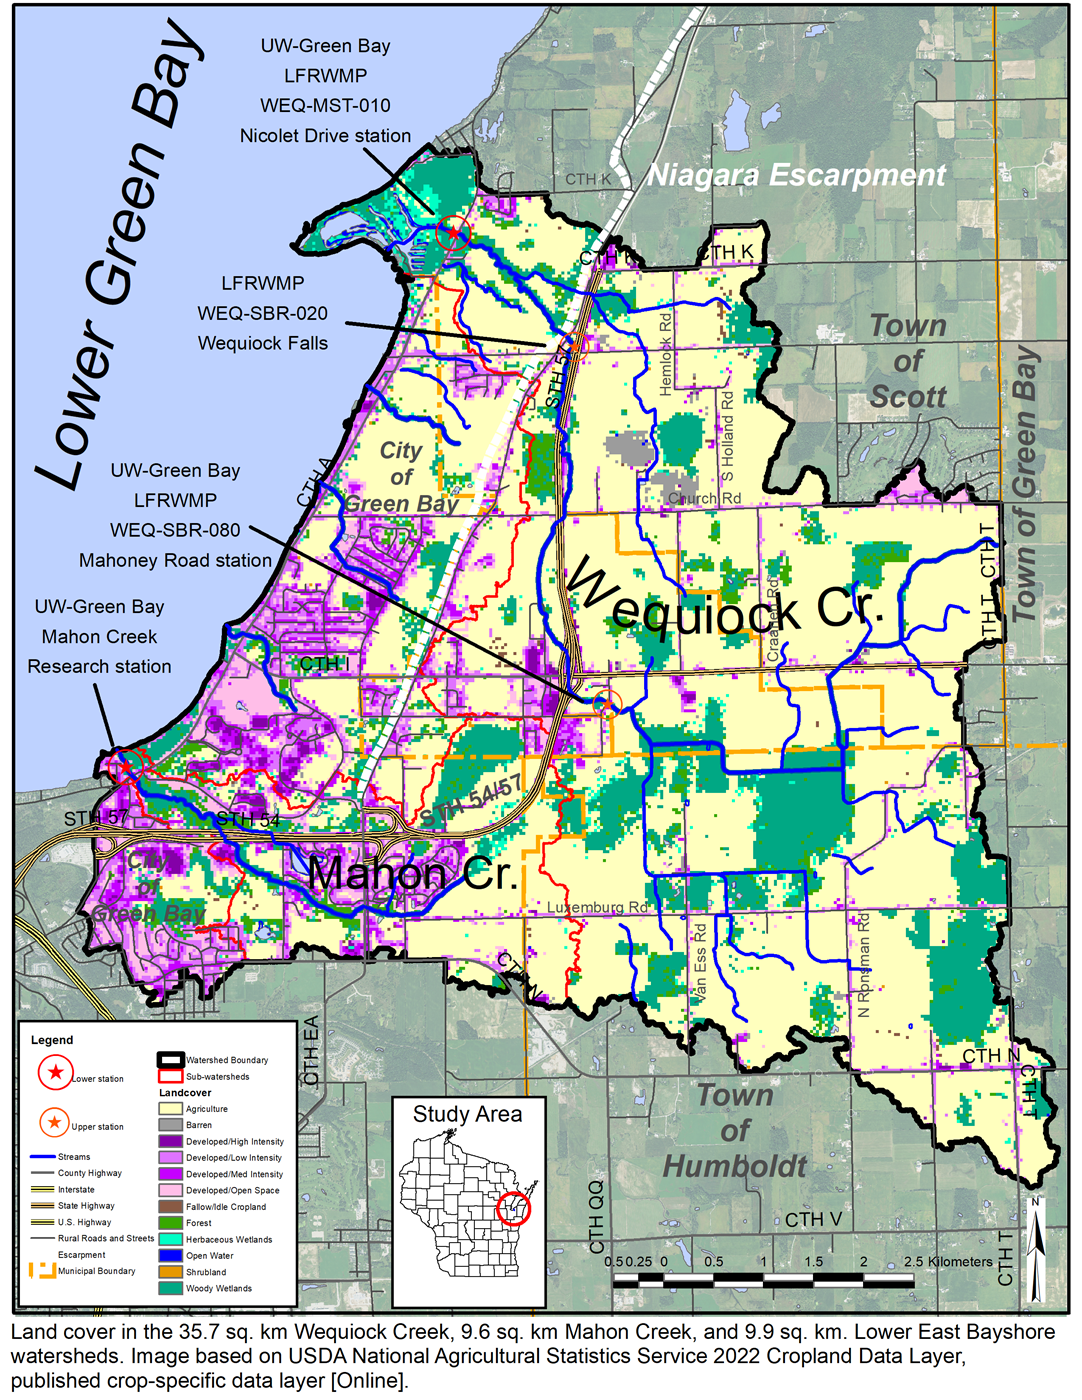
Table of 2022 land cover percentages in school watersheds and selected Lower Fox River watersheds, based on the USDA National Agricultural Statistics Service 2022 Cropland Data Layer, published crop-specific data layer.
| Watershed | Farmland | Forest | Quarry Barren | Wetland Open | Wetland Forest | Water | Urban Low | Urban Medium | Urban High | Area (km2) | Land Cover (pdf) |
|---|---|---|---|---|---|---|---|---|---|---|---|
| Apple Creek | 61.1 | 2.8 | 0.4 | 0.6 | 3.9 | 0.5 | 18.3 | 9.5 | 2.9 | 140 | 2004 vs 2022 |
| Ashwaubenon Creek | 63.2 | 3.0 | 0.2 | 0.3 | 4.5 | 0.2 | 14.3 | 9.5 | 4.8 | 75.4 | 2004 vs 2022 |
| Baird Creek | 63.9 | 3.0 | 0.2 | 1.3 | 6.2 | 0.1 | 16.8 | 6.3 | 2.3 | 66.4 | 2004 vs 2022 |
| Duck Creek | 56.2 | 6.6 | 0.3 | 1.7 | 15.3 | 0.3 | 14.0 | 4.1 | 1.4 | 394 | 2004 vs 2022 |
| Dutchman Creek | 53.9 | 3.6 | 0.7 | 0.7 | 6.3 | 0.1 | 19.0 | 10.1 | 5.6 | 77.9 | 2004 vs 2022 |
| East River | 62.4 | 5.7 | 0.6 | 0.9 | 6.6 | 0.2 | 16.1 | 5.7 | 1.8 | 374 | No data |
| Kankapot Creek | 68.9 | 5.3 | 0.4 | 2.3 | 6.0 | 0.5 | 10.6 | 5.0 | 1.1 | 66.8 | 2022 |
| Mahon Creek | 35.9 | 4.9 | 0.2 | 1.0 | 13.1 | 0.5 | 30.9 | 11.7 | 1.8 | 9.6 | 2014 vs 2022 |
| Mahon w/o Urban | 43.3 | 5.1 | 8.7 | 1.2 | 14.4 | 0.6 | 25.2 | 1.2 | 0.2 | 7.3 | |
| Neenah Slough | 43.2 | 3.0 | 1.1 | 3.0 | 6.0 | 0.7 | 21.2 | 15.3 | 6.4 | 59.2 | 2022 |
| Pigeon River | 67.2 | 9.0 | 0.2 | 1.1 | 9.5 | 0.6 | 9.6 | 2.4 | 0.4 | 203 | 2022 |
| Plum Creek | 77.7 | 5.3 | 0.2 | 0.4 | 5.8 | 0.5 | 8.0 | 1.7 | 0.4 | 93.1 | |
| Spring Brook | 77.9 | 2.7 | 0.1 | 6.8 | 4.0 | 0.4 | 6.7 | 1.1 | 0.2 | 55.8 | 2004 vs 2022 |
| Trout Creek | 47.7 | 11.9 | 0.4 | 1.3 | 23.4 | 0.2 | 12.8 | 2.0 | 0.3 | 39.2 | 2004 vs 2022 |
| Waupaca River | 41.9 | 34.1 | 0.1 | 2.3 | 11.8 | 1.5 | 7.0 | 1.1 | 0.3 | 745 | 2022 |
| Wequiock Creek | 67.1 | 3.0 | 0.9 | 1.7 | 17.2 | 0.4 | 7.2 | 1.9 | 0.6 | 35.7 | 2014 vs 2022 |
| Lower Fox | 2004 vs 2022 | ||||||||||
| Fox-Wolf Basin | 2022 |
Soil Maps and GIS Files
GIS boundaries and location files of streams help us visualize and analyze the spatial relationships between land and water. This information is essential for understanding how different land uses impact water quality and planning conservation efforts.
This table contains links to map image files and Geographical Information System (GIS) boundary and location files of streams in the Lower Fox River Watershed Monitoring Program and Fox-Wolf Basin. See NRCS Web Soil Survey for more information.
| Watershed | Boundary images and GIS shapefiles | Soils NRCS | Bird Survey Sites |
|---|---|---|---|
| Fox Wolf Basin | SSURGO Hydro-group and permeability PDF | N/A | |
| Lower Fox River | PDF (boundary shapefile) (major boundary shapefile) (large L. Fox Ortho-photo) | PDF Statsgo (PDF) | Shapefile of Surveyed Sites (2004-07 locations all same; WTM coordinates) |
| Wequiock Creek, Mahon, East Shore | 2022-PNG 2022-PDF (2020 boundary shapefiles) (2018 boundary shapefile) | SSURGO Hydro-group (PDF) Soil Slope % (PDF) | N/A |
Climate
- Rain Gauges in Lower Fox River Subbasin (pdf)

Ask an Expert
Ask Lynn Terrien, Outreach and Education Coordinator for the program. If you have questions, she can help!