Watershed Monitoring
Developing
Water Scientists
In our very own backyard.
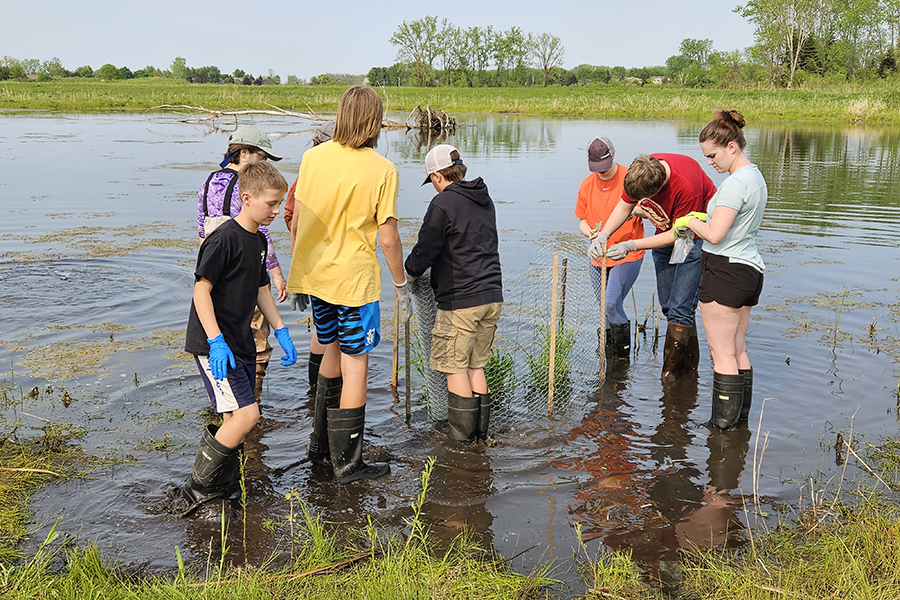
It's a lot more than just taking samples! When we engage high school students in collecting water quality data, we inspire and educate future water scientists, engineers, managers and policymakers. Our watershed teams also explore independent research projects about their watersheds that benefit their local communities directly.
Education & Information
Our work is significant to the broader community in two ways: we provide innovative hands-on environmental science opportunities for students, and we add to a body of scientific data about our watersheds. Beyond educational benefits, the school-based teams contribute to an established database of water resource conditions that can be used to assess long-term trends and evaluate restoration efforts.
When & How We Collect Data
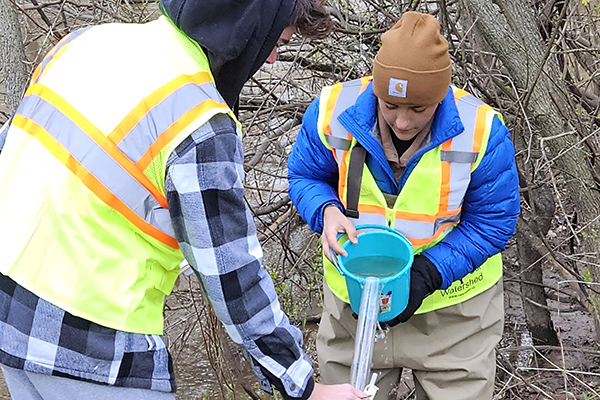
Whether you're a researcher or community member interested in our work, this helps you understand how we collect our data.
The Scientist's Method
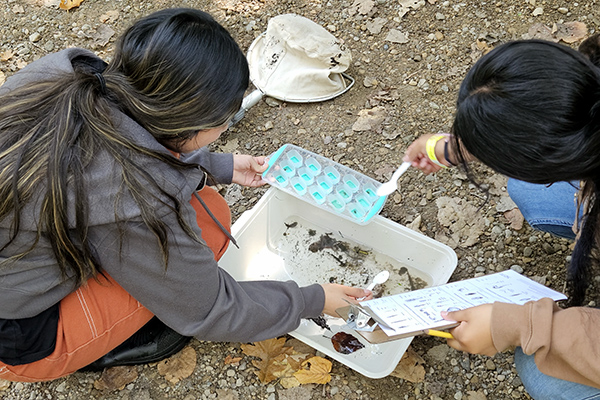
To create true water scientists, our methods for student researchers are the exact same that professional scientists use in their work.
See the Watersheds
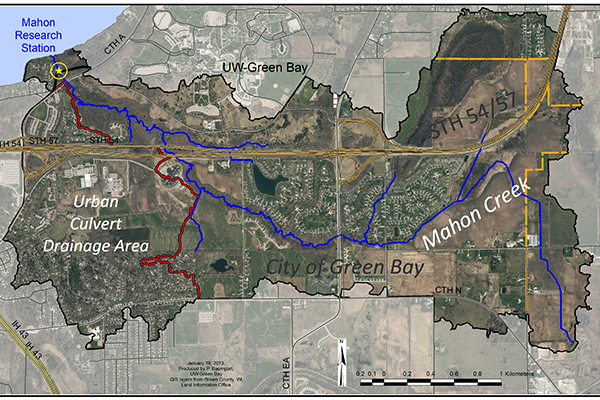
Our teams collect important data, including land cover and soil maps. View this data through our series of maps for each watershed.
""Fox River Monitoring has inspired me to pursue science in my post high school path. The field work and lab work involved creates a strong understanding of our local waterways, something that is a vital part of understanding your natural environment."
Student at Southwest High School
Ask an Expert
Ask Lynn Terrien, Outreach and Education Coordinator for the program. If you have questions, she can help!