Mahon Woods and Creek
A Canopy of
Trees
Witness the remnants of ancient forests.
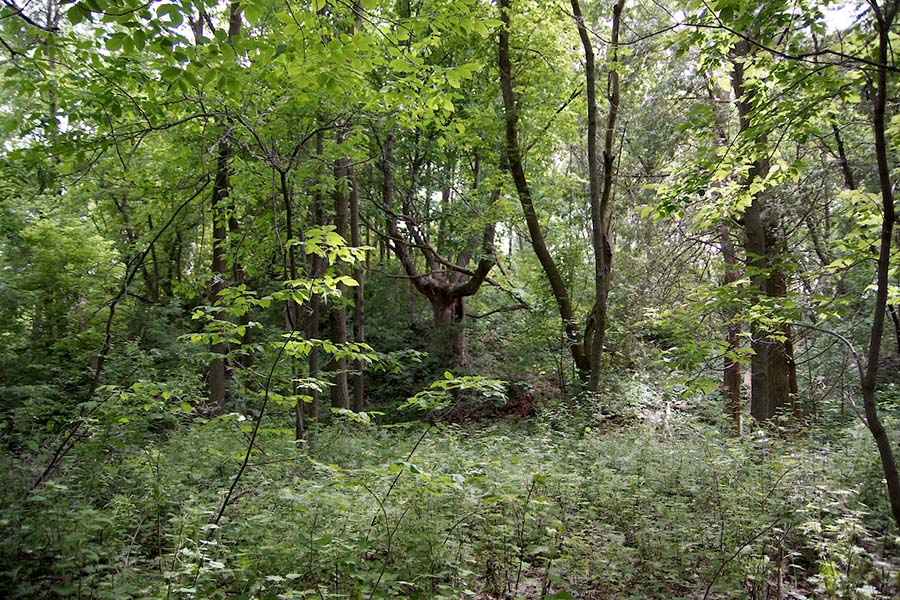
Mahon Woods is a living memory of the forests that once covered nearly all of Brown County. Mature oaks (Quercus alba, Quercus rubra) dominate the upland portions. In some places, there's an understory of sugar maple (Acer saccharum), a shade-tolerant tree that eventually may become a dominant species in this forest. A few large white pines (Pinus strobus) surge through the canopy of deciduous trees. Other portions of the forest are younger and have a mixed tree species composition. Altogether about 59 species of trees and shrubs are known from Mahon Woods.
Animals Abound
The woods have become an important sanctuary for birds and other animals.
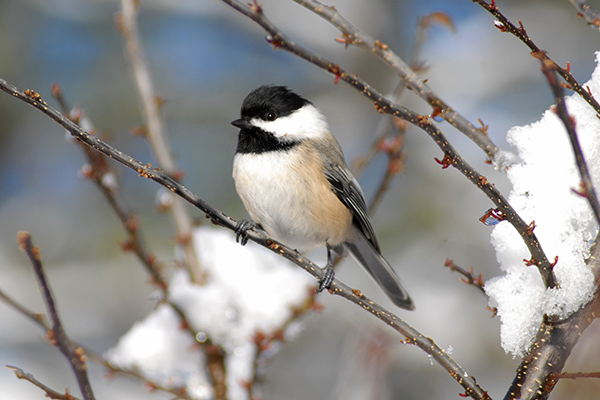
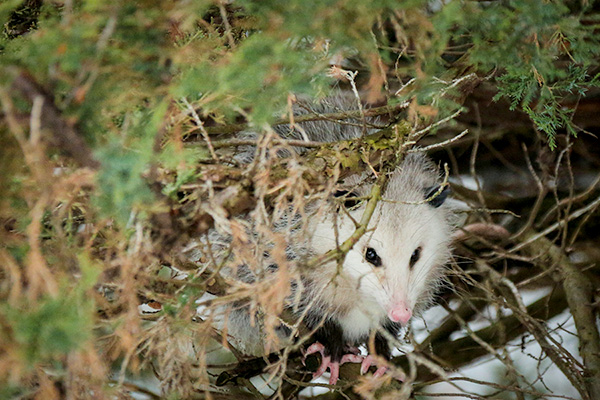
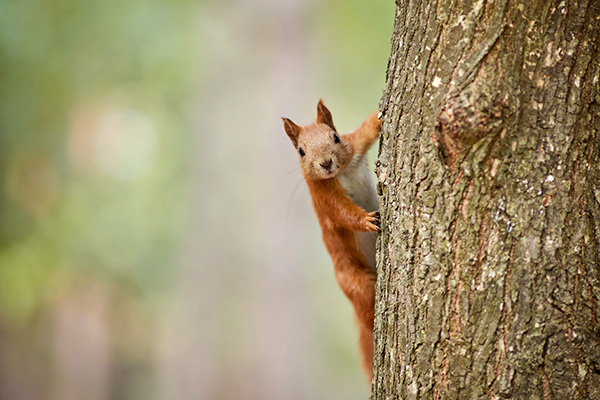
Except for places like Mahon Woods, species like the red squirrel have disappeared from much of their former range in central and southern Wisconsin. Unlike intensively managed forests, the woods retains old and decaying trees or "snags," which provide important cavities for many types of animals, including southern flying squirrel (Glaucomys volans), raccoon (Procyon lotor) and eastern gray tree frog (Hyla versicolor). Fallen logs on the ground provide important shelter for species like short-tailed weasel (Mustela erminea) and red-backed salamander (Plethodon cinereus). If you listen carefully along the trails, you'll almost certainly hear cavity-nesting birds like red-bellied woodpecker (Melanerpes carolinus), black-capped chickadee (Poecile atricapillus) and white-breasted nuthatch (Sitta carolinensis).
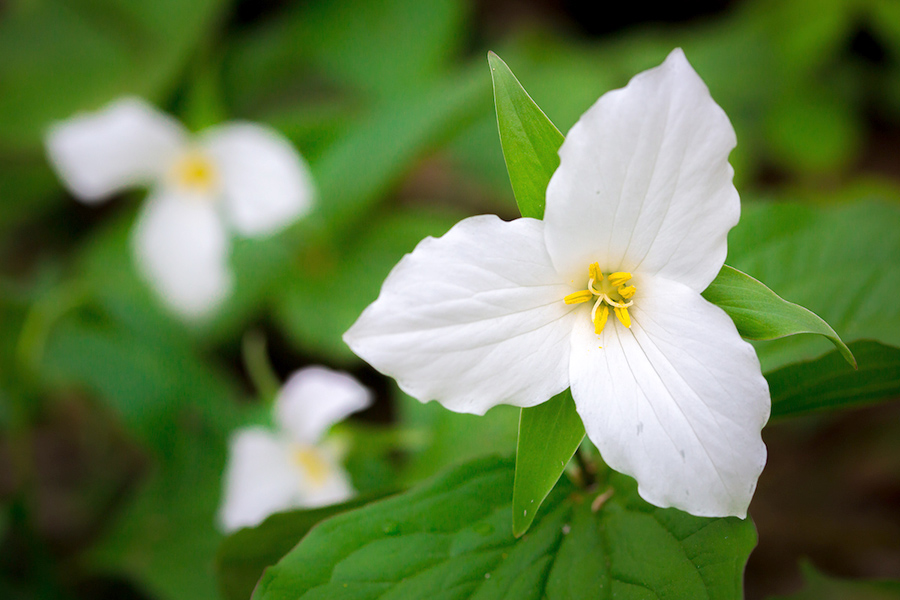
Showers Bring Flowers
Spring is your time to enjoy the show!
Imagine walking through a sea of blooming flowers, each one vying for your attention with its vibrant colors and unique shapes. The dedicated botany student will spot trillium (Trillium grandiflorum), trout lily (Erythronium americanum, E. albidum), violets (Viola sororia, V. pubescens), toothwort (Dentaria laciniata, D. diphylla) and other species taking advantage of the favorable light conditions that occur before the canopy trees leaf out. Spring is the prime flower-show time.
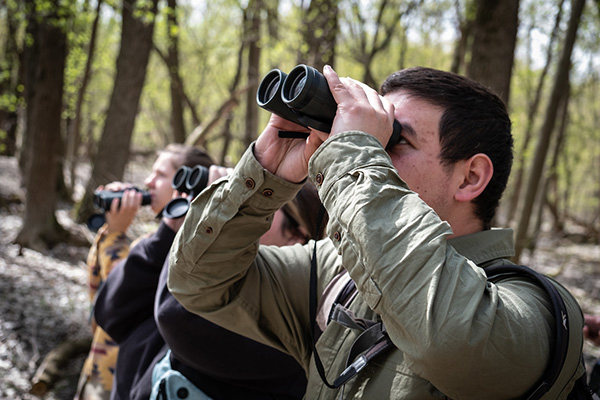
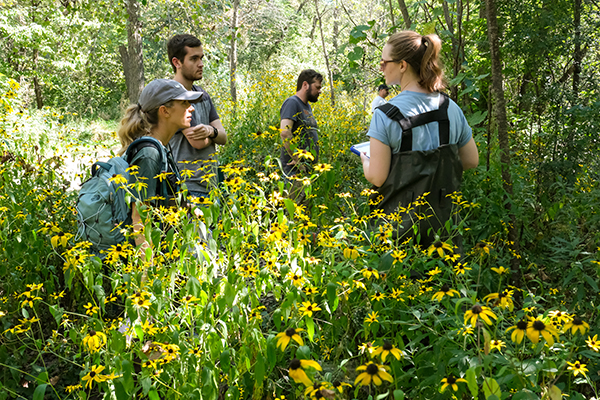
Research in the Woods
290 acres of natural environment right on campus helps provide easy access to research for our students and faculty. In Mahon Woods and Creek, we focus on three major areas.
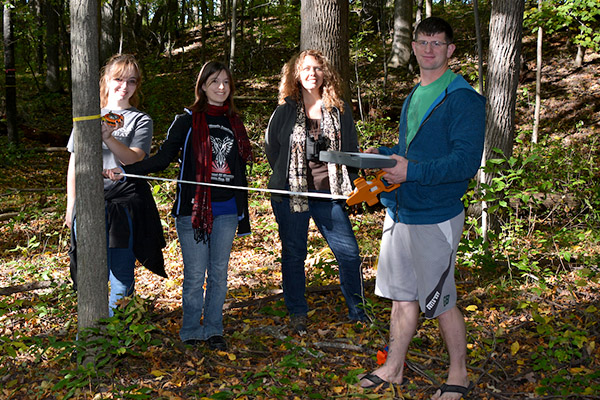
Smithsonian Data
We've established a permanent forest study plot in Mahon Woods. Teams of students are measuring trees in the plot to contribute data to an international forest ecology program run by the Smithsonian Institution.
Studies on Flora & Fauna
Because of the diversity of animals and plants in the woods, faculty and students routinely complete projects including studies on snakes, arthropods, fungi, understory plants and fish.

Water Monitoring Station
Mahon Creek runs through much of the Mahon Woods and empties into the Bay of Green Bay. A water monitoring station records data to inform water quality management.

Meet Your Guide
Meet Andrew LaPlant, UW-Green Bay alum and Natural Areas Manager. In addition to leading ecological restoration efforts, he also facilitates outdoor classroom experiences for students. If you have questions about our Mahon Woods and Creek, he can help!